















 7-in-1 effect
 Hygiene + limescale
 Hotel water consumption
 Case studies









Blog
Water Charges: Why Where You Live Can Cost You Hundreds of Euros in Difference
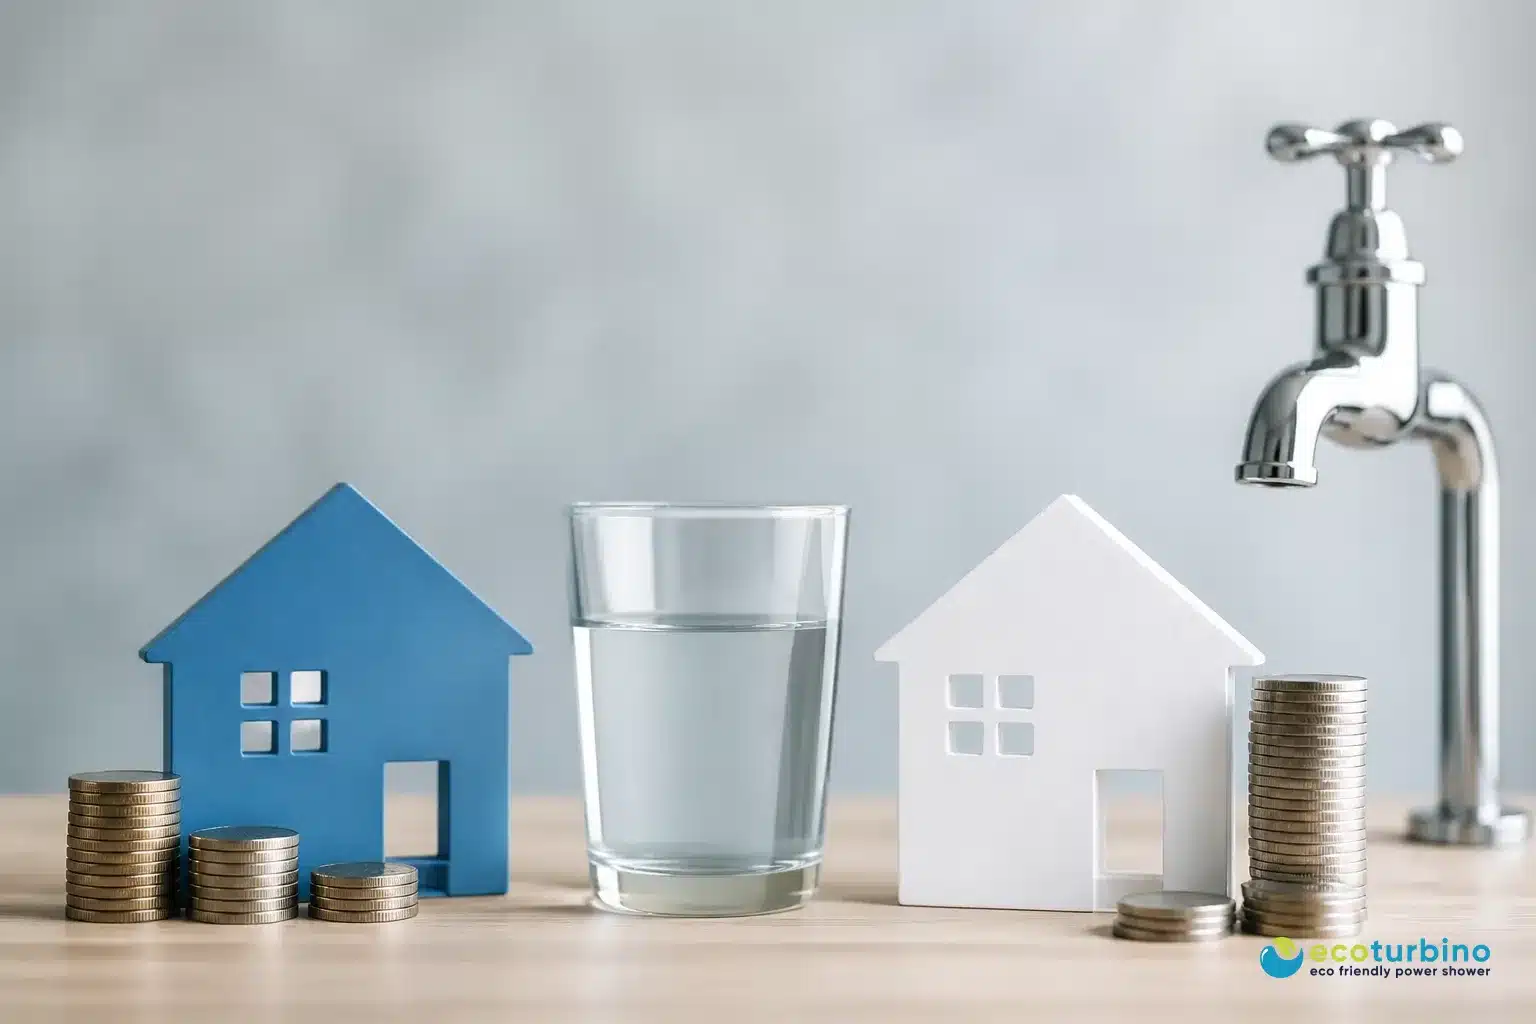
Water charges are anything but consistent from one town to the next. Depending on where you live, the same household can end up paying several hundred euros more or less a year for water and wastewater – not because they’re using more water, but simply because of their postcode. Vorarlberg offers a striking example, with real figures to back it up, and it’s a good starting point for asking how much control a household actually has over its own consumption-based costs.
Between the most expensive and the cheapest municipality in our example, there’s a difference of €683 a year in wastewater charges alone – despite the two towns being just 62 kilometres apart.
How much do water charges really vary between municipalities?
This piece was prompted by a report from VOL.AT on the sometimes huge differences in water charges across Vorarlberg’s 96 municipalities. The report highlights the scale of the gap without putting exact figures on it – so we’ve worked out some comparison numbers of our own to fill that gap.
Gaschurn versus Bregenz
For a four-person household, the difference is especially stark when comparing an alpine village with a city:
| Municipality | Wastewater charge per year | Household type |
|---|---|---|
| Gaschurn | €1,009 | Four-person household |
| Bregenz | €326 | Four-person household |
| Difference | €683 per year | – |
Why terrain and population density affect the price
Part of the gap comes down to how each municipality is structured. Gaschurn covers 177 square kilometres with around 9 residents per square kilometre. Bregenz, by contrast, covers just under 30 square kilometres with 992 residents per square kilometre. In a densely populated city, the cost of the pipe network and treatment plant is spread across far more households than in a sprawling alpine municipality.
The Tafamunt project in Gaschurn shows just how costly building and maintaining infrastructure can be in mountainous terrain: slope stabilisation, rock face work and shaft construction alone were budgeted at €800,000, out of a total budget of €2.5 million for water and wastewater works. Costs like these feed into charge calculations for years afterwards, which helps explain why municipalities with difficult terrain tend to charge more than densely populated valley towns.
When charges bring in more than the actual costs
Not every difference can be explained by real costs alone. According to the audit report, some municipalities showed shortcomings in transparency and lawful cost calculation, with charge revenue in certain cases said to exceed actual expenditure by more than 200 per cent. This figure should be checked against the exact source in the report before publication.
Download the Court of Audit reportWhat households can actually influence
As a household, there’s nothing you can do about the standing charge a municipality sets. The consumption-based part of the bill, though, is a different story – and with many tariffs, it makes up a significant chunk of the total.
What actually appears on a water bill
A typical municipal water bill is made up of several elements:
- the price per cubic metre of fresh water
- the wastewater or sewerage charge per cubic metre
- a standing charge or meter fee, regardless of usage
- any flat-rate fees or surcharges that may apply
Only the consumption-based items – the water price and the wastewater charge per cubic metre – respond to lower usage. The standing charge stays the same as a rule, no matter how much water actually flows through the meter.
How to work out your own tariff
It’s worth taking a few minutes to check a handful of documents to make sense of your own bill:
- your most recent water and wastewater bill, showing consumption in cubic metres
- note the water and wastewater charges separately
- record standing charges and flat fees on their own
- check your municipality’s current fee schedule, since tariffs change regularly
- use this to work out the cost per cubic metre and your total annual bill
Municipalities revise their charges from time to time, so a tariff from two years ago may no longer apply today.
Showering: the biggest lever for cutting water use
In most households, showering accounts for a large share of drinking water consumption. In our model calculation for a four-person household, we’ve assumed around 120,000 litres, or 120 cubic metres, a year for this alone. Since one cubic metre of fresh water generates roughly one cubic metre of wastewater, cutting shower usage has a double effect: it lowers both the fresh water bill and, where charges are consumption-based, the wastewater charge too.
Set by the municipality
- the standing charge, regardless of usage
- the price per cubic metre of water and wastewater
- investment costs for the pipe network and treatment plant
- the municipality’s own cost calculation model
Down to your own consumption
- the cubic metres of water actually used
- the consumption-based share of the wastewater charge
- the energy needed to heat the water
- shower length and the number of showers per person
Worked example: 40 fewer cubic metres a year
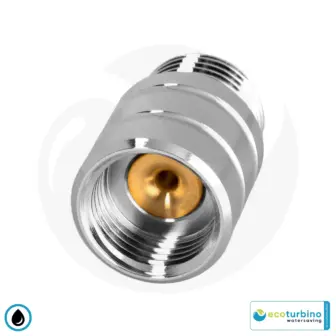
For our ecoturbino® ET10L, we work on the basis of a water saving of 40 to 50 per cent. Starting from a baseline of 120 cubic metres of shower water a year, that works out to a saving of around 40 cubic metres of fresh water – and, where billing is consumption-based, the same reduction in wastewater. On top of that comes the lower energy demand for heating the water.
Applied to our two example municipalities, this works out as follows:
- Gaschurn: around €180 to €250 in charge savings per year
- Bregenz or the Rhine Valley: around €250 to €400 in total savings per year, including water-heating energy
These figures are a model calculation based on the assumptions stated above. For a calculation tailored to your own situation, you’d need the local water and wastewater price, the energy source used, shower duration and the number of people in the household.
How the ecoturbino® cuts shower water use
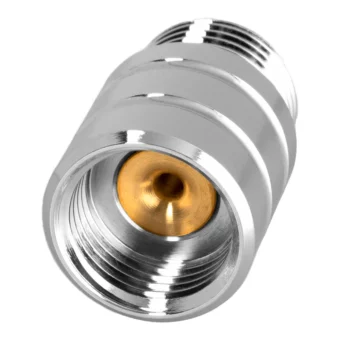
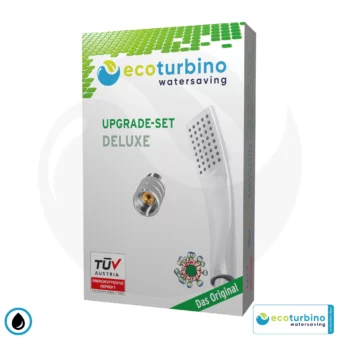
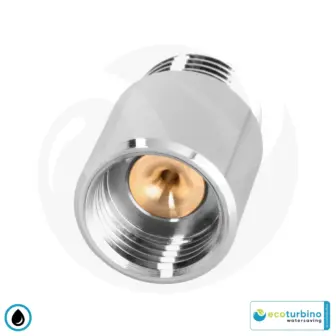
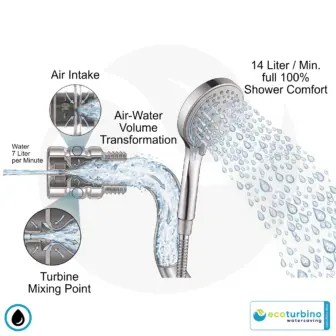
The ecoturbino fits between the shower fitting and the shower hose, no plumber required, in under five minutes. Inside, it mixes air into the water stream using a Venturi effect. This reduces the amount of water flowing through, while keeping the jet volume and shower feel just as you’d expect. The 40 to 50 per cent saving is documented in detail in the TÜV Austria report.
TÜV Austria
To see how water and energy costs can play out differently depending on region and climate, take a look at ecoturbino’s international case studies, documented across a range of countries and applications.
Purchase cost and payback time
How quickly the purchase pays for itself depends on your local water and wastewater tariff, the price of energy, the number of people in the household, and actual shower habits. There’s no single payback period that fits everyone, but you can get a rough idea by checking your own water bill against the model figures above.
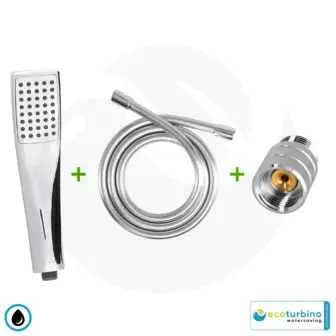
Water saving @shower
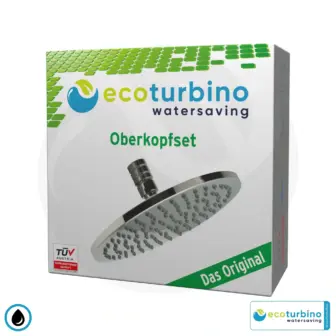
Water saving @sets
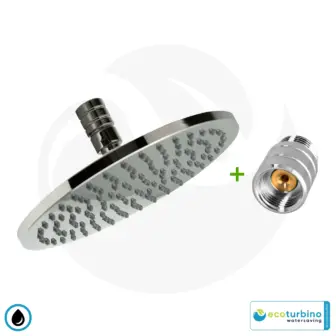
Water saving @sets
Frequently Asked Questions
Densely populated municipalities spread the cost of the pipe network and treatment plant across more households, while sprawling alpine municipalities face costlier construction and maintenance work. On top of that, municipalities calculate their charges differently, and revenue doesn’t always match actual costs precisely.
Typically, you’ll find the price per cubic metre of water, the wastewater charge per cubic metre, and a standing charge that doesn’t depend on usage. Some bills also include meter fees or flat-rate charges.
In our model calculation, shower water use drops by 36 to 40 per cent. Starting from 120 cubic metres a year for a four-person household, that means around 40 cubic metres less per year.
The ecoturbino mixes air into the water stream using a Venturi effect, so the jet volume and shower feel stay the same while less water flows through.
No. The standing charge is set by the municipality regardless of consumption. Only the consumption-based part – the water and wastewater price per cubic metre – can be influenced.